
Wednesday February 11, 2015
Back in January of 2014, Governor Jerry Brown asked California residents to cut water use by 20 percent in the midst of this Exceptional Drought. Since July 2014, public water providers with more than 3,000 customers have been required to track and submit water use each month. Using a simple formula, water providers estimate daily per-person water use, or gallons per capita per day (GPCD), by dividing the total monthly potable water production by the number of people served, and then diving by the number of days in the month (GCPD=Total monthly potable water production/Total population served/Number of days in the month). The State Water Resources Control Board (SWRCB), the agency responsible for tracking this data, warns against comparing residential GPCD without accounting for relevant factors such as rainfall, temperature and evaporation rates; population growth; population density; socio-economic measures; and water prices. But looking at some of the disproportionate residential water use throughout the state is enough to get a person’s blood boiling!
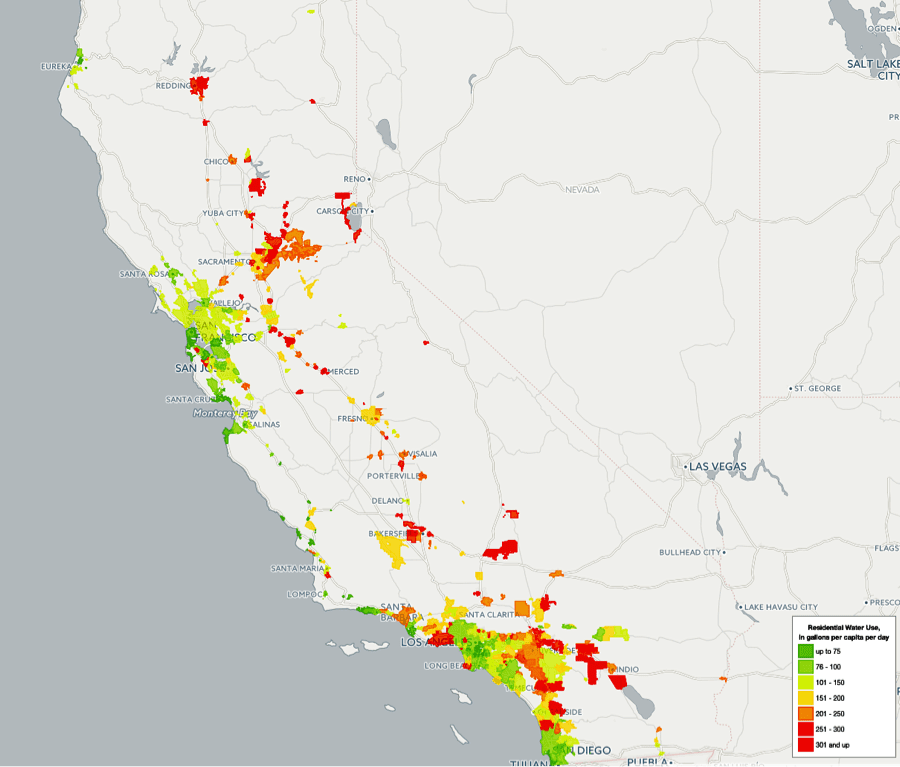
Darkest green areas indicate 75 gallons per person per day or less, while red areas indicate 251-300 gallons per person per day, or more. When news outlets reported last month on statewide water usage for November, there was outrage over lack of water conservation in some regions. Residential water use in November 2014 was down only 9.8 percent from the same month the previous year. But when the December figures were released last week, urban water conservation finally met and exceeded the Governor’s goal for the first time, with a statewide reduction of 22 percent. It is hard to tell at this point if the reductions were due to conservation measures or are mostly a result of the above-average rainfall during that month. If you’re curious about how your water community compares, the Pacific Institute recently released an interactive map of California’s residential water use. It makes comparing municipalities easy with color-coded shading and trend graphs that pop-up when districts are selected.
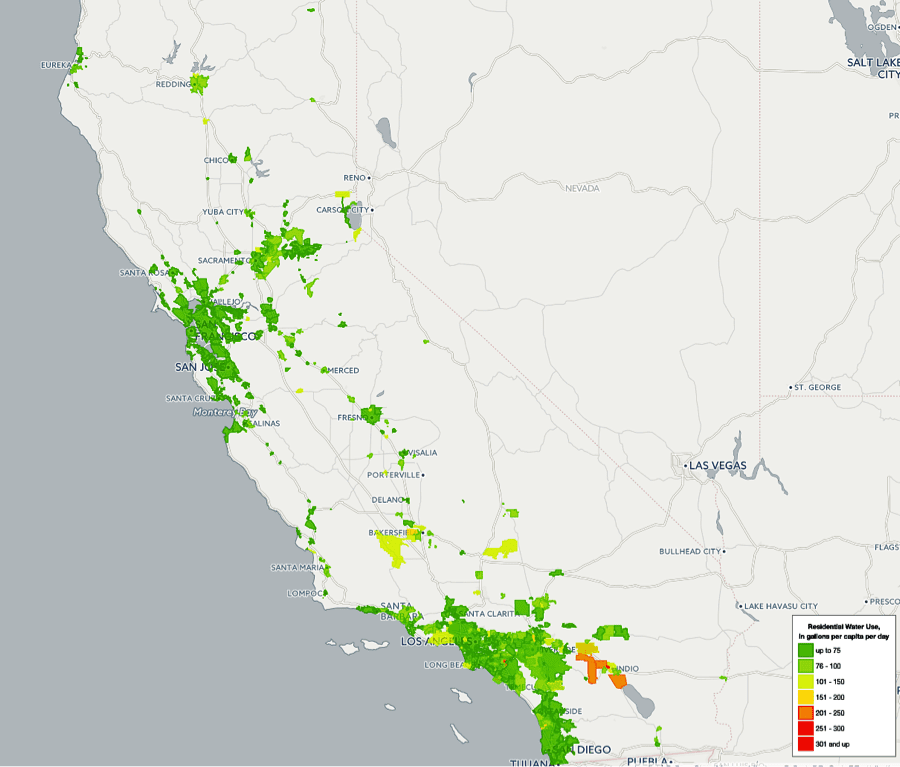
Some standout communities with reduced water usage in December include Monterey, San Francisco, Santa Cruz and San Diego, which all used less than 50 GPCD. Unfortunately, there are still plenty of water hogs, and 47 municipalities reported using 100 GPCD or more. The state average in December was 67 GPCD, but only 20 percent of the population met the performance standard for indoor use of less than 55 GPCD. However, according to the SWRCB monthly press release, since data collection began in July 2014, Californians have saved 134 billion gallons of water, or enough water to supply 1.8 million of the state’s 38 million residents for a year! This is encouraging news, and provides hope for continued water conservation as the drought drags on. We recommend that everyone check out how your community compares when it comes to being water wise. For more information on how you can do your part, visit SaveOurWater.com and Drought.CA.Gov.