
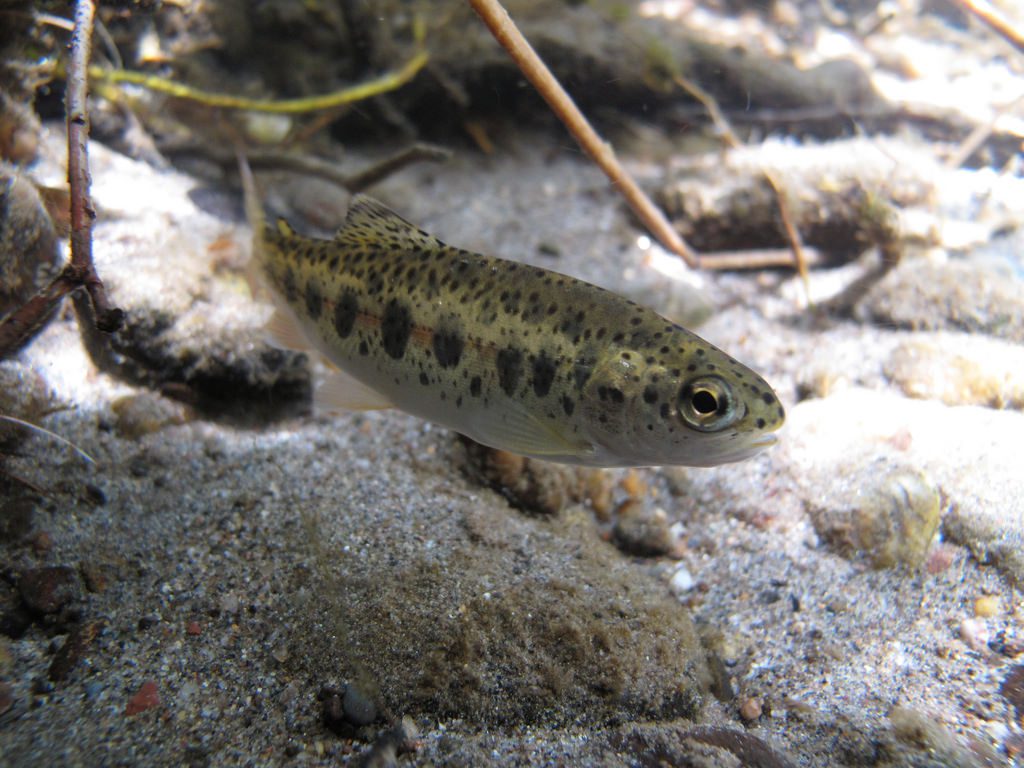
Summary report of 2015 Oncorhynchus mykiss snorkel surveys
The health of the Stanislaus River population of Oncorhynchus mykiss (rainbow trout and steelhead) has become an increasing concern due to changing conditions in the river. Water temperatures have been unusually warm over the past year due to low storage in New Melones Reservoir. The reservoir’s coldwater storage has now been depleted by a combination of continued drought and high water releases in recent years. As a result, the temperatures of released water have increased substantially. Annual snorkel surveys to estimate the abundance and distribution of O. mykiss provide an opportunity to document shifts in the population in response to changes in habitat and water temperature in the Stanislaus River, and have been conducted every late-summer or early fall since 2009. The 2015 snorkel surveys were completed in mid-August, and reveal a drastic decline in the abundance of the O. mykiss population. This report presents our initial findings from the 2015 survey, and explores potential mechanisms leading to the substantial declines in abundance of O. mykiss in the Stanislaus River. In addition, the results from the 2015 surveys were compared to results from surveys conducted since 2009.
Key Findings
- O. mykiss abundance substantially declined from a long-term average (2009-2014) of just over 20,000 fish to only about 5,000 fish in 2015. The previous low was recorded during 2009, when abundance was estimated to be 14,000.
- Densities, or numbers of mykiss per river mile or per habitat unit, have been on the decline since 2013, with 2015 densities the lowest on record. The most dramatic decline has been observed between Goodwin Dam and Knights Ferry.
- All age classes were represented in 2015, and there have been no notable shifts in age composition over the period of record. The observation of young-of-year in August 2015 provides evidence of at least some successful reproduction during 2015.
- There has been no change in the downstream extent of distribution of mykiss since 2009, with O. mykiss consistently observed downstream to Highway 120. Highest densities and abundances of O. mykiss are consistently found in Goodwin Canyon.
- Small year-to-year variations in flow do not substantially affect abundance. However, abundance may increase in response to extremely high flood control releases and cooler temperatures during years of heavy precipitation.
- Since summer 2014, water temperatures have been elevated to an unprecedented degree due to low reservoir storage. mykiss abundance has decreased in response to elevated water temperatures, the warmest of which were recorded during the summer of 2015. Although conditions improved in 2016, the water year is still classified as “dry”, and O. mykiss abundance is expected to decline even further in the summer of 2016.
- Non-salmonid species such as Tule perch and black bass, which generally prefer warmer waters, were observed in greater abundances and further upstream during 2015 than in previous years. Striped bass also appeared to be more abundant in 2015 than in previous years.
Methods
With the exception of one year (2011) when the lowest reach was not sampled, surveys have been conducted annually from Goodwin Dam to Oakdale (Figure 1). The methodology used is a two-stage sampling scheme originally developed by Hankin and Reeves (1988). The survey methodology has been adapted slightly in order to survey larger and longer habitat units, with the key difference being the use of up to four divers in each selected habitat unit. Detailed survey methodology, key assumptions, and estimation methods can be found in Lee et al. (2015). Briefly, habitat units are classified into four different habitat strata (runs, riffles, pools, and cascades); however, only runs, riffles, and pools are surveyed. Estimated total abundance is calculated by multiplying the average number of fish estimated in each habitat strata (e.g., riffles) by the total number of habitat units. The total abundance does not include O. mykiss that potentially reside in cascades or other units that cannot be surveyed due to safety concerns, but these represent a very small amount of total habitat area. The units are randomly selected for the first stage (units are dove one time) and the second stage (units are dove four times).
Snorkel surveys were conducted from August 3–12, 2015, using similar methods relative to previous years, but with an increased sampling rate within each habitat stratum. Survey effort was also shifted from lower reaches (Valley Oak to Oakdale) to upper reaches (Goodwin Canyon) to increase the precision of the abundance estimates. It should be noted that these shifts in sampling effort between reaches do not bias or affect the resulting estimates of abundance in a substantial manner, but they do typically result in greater certainty in the estimates by reducing the confidence intervals surrounding the point estimates. No other changes in methodology or personnel have occurred since 2009.

Results
O. mykiss Population Characteristics
Abundance
The estimated abundance of O. mykiss (all life stages combined) in the Stanislaus River based on snorkel surveys in 2015 was 5,012 fish, which is the lowest abundance on record (Figure 2). River-wide abundance estimates from 2009 to 2014 have averaged just over 20,220 O. mykiss, and have never been estimated to be less than about 14,000 (2009). In terms of percentage, the 2015 estimate is about 25% of the long-term average and 35% of the previous lowest estimate. Prior to 2015, no significant fluctuations in abundance were observed, with the exception of 2012, when estimates of abundance were > 37,000 O. mykiss from Goodwin Dam to Oakdale.

Age Composition
Both age classes of O. mykiss (young-of-year (YOY) and Age 1+) have been observed each year since 2009, with no notable shifts in age composition over the period of record (Figure 3). The abundance of both age classes has generally declined as total abundance has declined. Although the presence of YOY in 2015 indicates at least some successful O. mykiss reproduction during this year, fewer individuals were observed relative to previous years. Low abundance of YOY below Orange Blossom is expected, as nearly all spawning occurs in the Goodwin and Knights Ferry reaches. The most substantial decline in YOY abundance occurred in the Knights Ferry reach, where elevated water temperatures have likely had a greater impact on reproductive success than in the Goodwin reach, which typically has cooler temperatures.

Density
We selected two metrics to describe population density: the number of O. mykiss calculated per river mile, and the average number counted in each of the sampled habitat units. Each of these metrics can be compared across reaches both within and between years.
Both metrics showed that the highest densities of O. mykiss are consistently found in Goodwin Canyon, with long-term averages of 3,724 O. mykiss per mile and 91.9 O. mykiss counted per unit sampled during 2009-2014. In 2015, densities in Goodwin Canyon dropped to 635 O. mykiss per mile (Figure 4) and 18.6 O. mykiss per unit, representing about an 80% decrease in density in 2015 relative to the long-term average.

Spatial Distribution
We evaluated occupancy for each year and reach to assess how many sampled habitat units were occupied by at least one O. mykiss. From 2009 to 2012, nearly all (~95%) of the sampled units in the Goodwin Canyon and Knights Ferry reaches contained at least one O. mykiss (Figure 5). Occupancy in the Knights Ferry reach began to decline in 2013, and in 2015, only 80% of the units sampled had at least one O. mykiss. Occupancy in the Goodwin Canyon reach also declined slightly in 2013, but remained high. In 2015, just under 85% of the sampled units were occupied in the Goodwin Canyon reach. A more precipitous decline was observed in the Orange Blossom Bridge reach, from nearly all units occupied in 2012 to less than 10% occupied in 2015.
Interestingly, the range of O. mykiss distribution did not substantially change in 2015 compared to previous years, unlike many of the other population characteristics examined. With the exception of 2011 when surveys only extended to Orange Blossom Bridge (RM 46.9), O. mykiss have consistently been observed, albeit at low densities, downstream to the Highway 120 Bridge (RM 41). The continued presence of individuals to this downstream extent demonstrates that while the population has sustained substantial impacts, some individuals are still capable of persisting in lower quality habitats and warmer temperatures. These more tolerant individuals are important for resiliency in re-building the population after events such as the current drought.

Flows and Water Temperatures
To evaluate the potential influence of flow on O. mykiss abundance, we plotted trends in abundance and flow, and found that small variations in flow from year-to-year do not substantially affect abundance (Figure 6). With the exception of peak O. mykiss abundance occurring in 2012, following extremely high flows due to flood control operations in 2011, abundance estimates have not tracked well with the volume of flow released during January–August of the year prior. For instance, flows were higher at Ripon in 2012 and 2013 than during 2008–2010. However, despite these higher flows, O. mykiss abundance was lower in 2013 than during 2009–2011, and abundance has continued to decline to the record low observed in 2015.
Regression analysis was also used to examine potential relationships between O. mykiss abundance and flow (Figure 7). While this analysis suggested that higher flows resulted in increased abundance, the trend was entirely driven by the flood control releases in 2011, which are well above the range of managed flows as specified in Table 2e of the Biological Opinion. We explored the relationship between flow and O. mykiss abundance under the Table 2e flows by excluding 2011 flows and the corresponding 2012 abundance. This revealed that under Table 2e flows, O. mykiss abundance appears to decrease as flows increase. While we believe flow during 2011 was a factor contributing to increased O. mykiss abundance in 2012, we do not believe that Table 2e flows directly influence O. mykiss abundance. Rather, it appears that differences in temperature among those years are the single most important factor driving abundance.
Due to low storage in New Melones Reservoir, water temperatures have increased substantially in the past several years (Figure 8). Mean monthly water temperatures in 2015 were higher during the months of May, July, and August than the maximum monthly water temperatures during those months from 1998–2012 (Figure 9). Mean monthly water temperatures during June 2015 were approximately the same as the maximum observed during June from 1998–2012. Mean monthly water temperatures were substantially higher (mean difference = 5.8ºF; range 3.1–10.6ºF) in 2015 than the long-term mean monthly water temperature from 1998–2012.
Estimated O. mykiss abundance during 2009-2015 tracks very closely with water temperatures, and lower O. mykiss abundances was observed in years following warmer summer temperatures (Figure 9). Because this trend shows a one-year lag in the observed response of the population to elevated summer water temperatures, an even greater decline in abundance may be on the horizon for 2016 as a result of the unprecedented temperature conditions during 2015. Further, the number of Age 1+ O. mykiss, a portion of which will form the spawning population in winter 2015/2016, has decreased substantially. This is expected to result in reduced production of YOY in 2016 in addition to the reduced Age 1+ population, resulting in an expected further decline in total O. mykiss abundance in 2016.
Regression analysis was also used to examine potential relationships between O. mykiss abundance and water temperature (Figure 8). Using the same approach as for flow, we analyzed trends with and without the 2012 abundance estimate. This analysis clearly shows declining abundance in response to increasing water temperatures. Water temperatures during summer 2015 were approximately 5ºF warmer than during 2014. Because such temperatures are well beyond the range of temperatures over which O. mykiss population response has been measured, we cannot use these relationships to project how low O. mykiss abundance is expected to be in 2016. However, the decline is expected to be at a rate at least equal to the decline observed between 2014 and 2015, where abundance in 2015 was only one-third of the estimated abundance in 2014.

Discussion

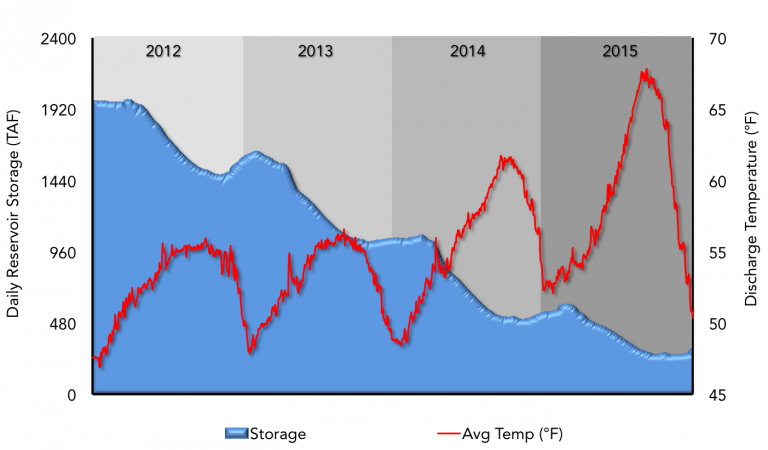


The decrease in abundance of O. mykiss in the Stanislaus River as evidenced by multiple metrics is alarming, but not surprising given the unprecedented water temperatures due to extremely low storage in New Melones Reservoir. Extensive water temperature modeling previously provided an indication that maintaining coldwater storage behind New Melones Dam is highly important for maintaining suitable temperature conditions downstream. This modeling had suggested minimum storage of at least 300,000 acre-feet in New Melones for maintaining suitable downstream water temperatures. Trends in water temperatures relative to reservoir storage and more recent modeling conducted by the U.S. Bureau of Reclamation now suggest that temperatures begin to rise as storage approaches 500,000 acre-feet. Observed temperature conditions during the recent drought as well as long-term, annual surveys to document the biological response of the O. mykiss population to these conditions further underscore the importance of maintaining adequate coldwater supply in New Melones. Elevated water temperatures may have contributed to decreased O. mykiss abundance in multiple ways, including mortality due to stress or disease, mortality due to predation, reduced reproductive success, and an increase in downstream migration.
Concurrent with the decline in O. mykiss abundance, other changes were observed on the river in 2015, with the substantial increase in water temperatures the likely causative mechanism. A pronounced shift in the fish community was observed below Knights Ferry, with higher relative numbers of Tule perch and black bass compared to previous years. Microhabitat usage by these species was also observed to have shifted relative to previous years. During surveys conducted from 2009 to 2012, observations of Tule perch and black bass were generally limited to slower currents and backwaters. During 2015, it was observed that these species were utilizing areas with higher current velocities near transitions from riffles to pools or runs. In previous years, these zones were more often occupied by O. mykiss. However, as a result of elevated water temperatures, occupancy has likely shifted, resulting in reduced O. mykiss abundancether notable changes in the aquatic ecology of the Stanislaus River included the observation of increased numbers of large striped bass as far upstream as Knights Ferry, a pronounced increase in filamentous algae on the substrate, and an apparent decrease in macroinvertebrate densities. All of these factors may be attributed to increased water temperatures and may contribute to reduced abundance of O. mykiss.
References
Hankin, D. G., and G. H. Reeves. 1988. Estimating total fish abundance and total habitat area in small streams based on visual estimation methods. Canadian Journal of Fisheries and Aquatic Science 45:834-844.
Lee, D., M. Hellmair, and M. Peterson. 2015. Big Chico Creek 2014 Fish Population Survey. Report available at: Report Download