Friday July 1, 2011
![]()
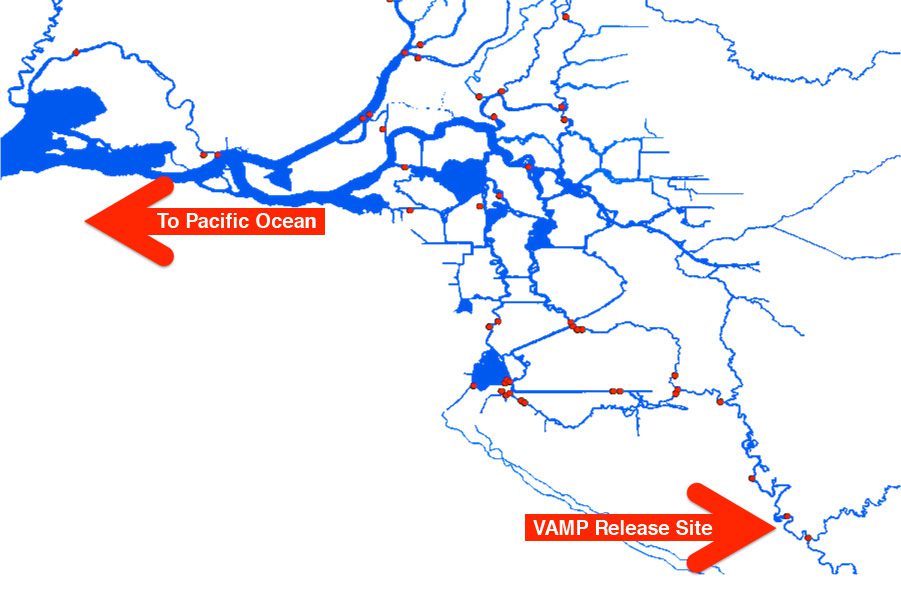
Although statistical modeling does not usually bring you fame or fortune, it does help you estimate the survival of juvenile salmonids using acoustic telemetry data. When researchers use telemetry to estimate the survival of salmonids through the Delta they track each individual fish and how far it made it along the various routes. For some studies, such as VAMP’s Chinook smolt survival study and the Six-year Acoustic Study of steelhead smolt survival conducted by the Bureau of Reclamation and Department of Water Resources, that are using HTI technology the downstream finish line (so to speak) is the river channel at Chipps Island near Pittsburg, CA. For others using VEMCO, the finish line is the array of receivers at the Golden Gate Bridge. So, you would think that estimating the proportion of fish that survived would be easy; you just take the number of fish that made it to the ‘finish line’ and divide it by the number of fish that you released at the start. . . done! But, of course, in reality research is never that easy. There are complicated equations that researchers employ to estimate survival of salmonids using telemetry data that account for things like, the probability that a fish was detected passing an acoustic receiver (no receiver technology is perfect), the battery life of the tag (sometimes tags can fail), and survival by river reach (some reaches are more dangerous than others).

This past week FISHBIO attended a two day workshop on analysis of tagging data for survival estimation held by two researchers from University of Washington and the U.S. Geological Survey. We learned the basics of the analysis and were trained on how to use various computer software designed by the folks at the University of Washington’s Columbia Basin Research (CBR) center. CBR is an interdisciplinary center for research of ‘mathematical ecology’, which provides quantitative tools for analyzing data collected on Columbia River Basin salmonid stocks. In addition they have a large database of real-time and historic environmental and fish population data for the region. During the workshop we learned how to use the program SampleSize to estimate various survival parameters during the study design stage, and the program USER to develop statistical models for analyzing our tagging data. We also touched on other topics such as, how to estimate the battery life of an acoustic tag, and how to tell if your tagged fish may have been consumed by a predator. The last one is especially challenging in the Delta, where numerous predators may consume tagged fish, and suddenly the researchers are tracking a striped bass instead of a Chinook salmon smolt. As we said. . .nothing is ever straight forward. For an example of how these models are applied to work in the Delta see Perry et al. 2010.
