
Monday January 20, 2014
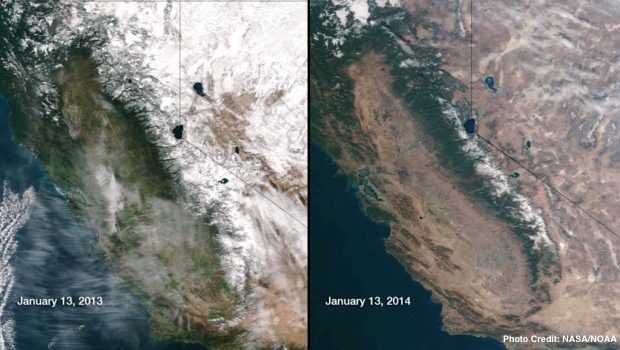
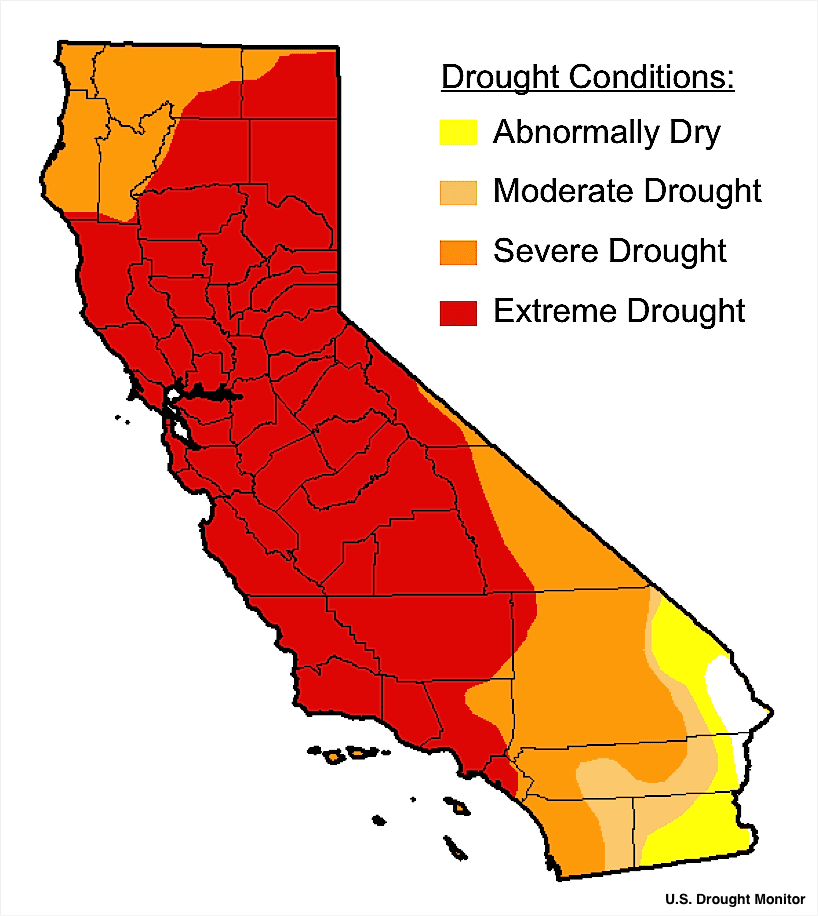
As a slew of recent headlines suggests, the water supply outlook for the San Joaquin Valley and the rest of California does not look good for 2014. In light of our lack of precipitation, snowpack, and water storage, Governor Brown recently declared the current drought an official state of emergency. The USDA Drought Monitor currently identifies 90% of the state in a Severe or Extreme Drought, with the worst conditions occurring in the southern Central Valley, and sure to have tremendous impacts on agriculture. Water managers around the state are scrambling to put water conservation measures in place for fear of a drought like that of 1976-77. However, some water saving measures, such as reducing the flows on the Sacramento and American rivers, will surely have damaging effects on Central Valley salmon and steelhead.
As in the winter of 1976-77, California can attribute the current lack of precipitation to a persistent high-atmospheric pressure zone off the West Coast, stretching four miles high and 2,000 miles long, which is causing weather systems to break up or move to the north. This so-called, “Ridiculously Resilient Ridge” has anchored itself for 13 months, since December 2012. The 2013 calendar year will go down as the driest year on record, with some locations receiving less than 50% of the previous lowest rainfall records. For instance, Santa Cruz received only 4.78 inches compared to the old record of 11.85 inches in 1929. Even Death Valley, the driest location in the U.S., received more rain (2.17 inches) than Paso Robles (1.92 inches; avg. 12.78), King City (1.98 inches; avg. 12.06), and Hanford (1.99 inches; avg. 10.10). The San Joaquin region has currently received 18% of the average rainfall over the last three months (see graph below), and the southern Sierra is on track to receive the driest water year on record. The northern Sierra is no better off, receiving only 16% of average rainfall in the current water year, which spans October 1st to September 30th.

A major source of California’s water is the Sierra snowpack, and as expected, the outlook is bleak. According to the Department of Water Resources snow water equivalents, the snow survey indicates 8% of normal for the Northern Sierra region, 16% of normal for the Central Sierra region, and 22% of normal for the Southern Sierra region. State wide, the average to date is 17%, and only 8% of the April 1st average, which is generally the peak date for snowpack water content.
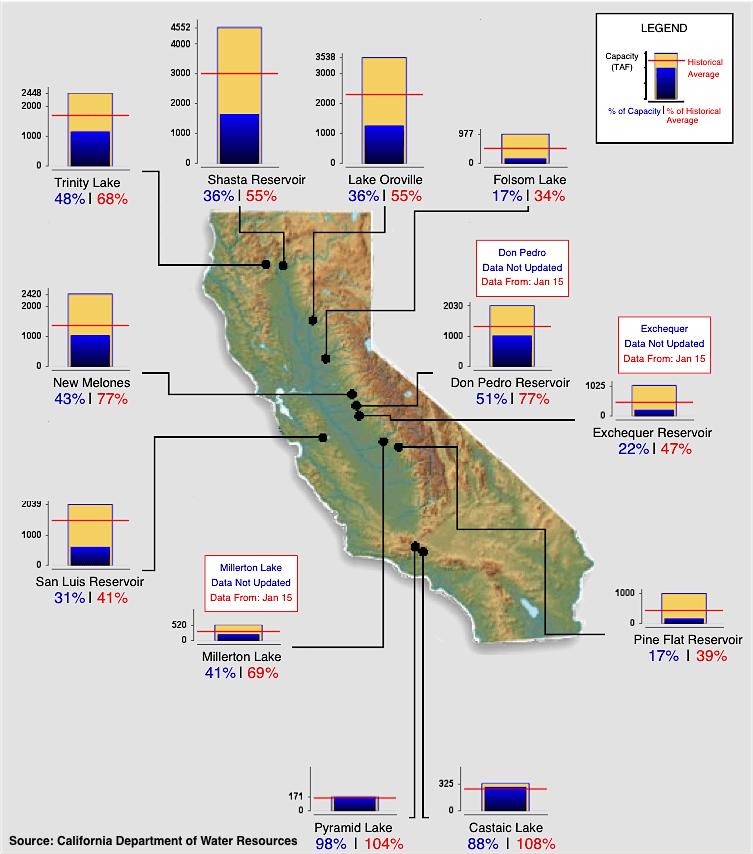
Surface water storage is also showing the effects of the driest year on record (see below). All of the largest reservoirs that we rely on for year-round water supply are substantially lower than average. Both Shasta Lake and Lake Oroville, the two largest reservoirs in California, are at 36% of capacity, and 55% of their historical averages. Some water districts are in worse shape than others: Folsom Lake on the American River is at a mere 34% of average, while New Melones and Don Pedro are faring better at 77% of average.
With a lack of foreseeable precipitation, water managers are particularly concerned about the possibility of additional years of extreme drought. Looking back at historical flow patterns helps us understand the potential magnitude and duration of modern droughts, but our records of measured precipitation and river flows only go back about a hundred years, just a snapshot in time. The study of dendrochronology uses tree rings of long-lived tree species to construct climate patterns from the past, and can help us understand the frequency of climatic events over longer periods of history. This tree-ring data can also be correlated to stream flows to construct flow models that date back centuries, such as a reconstruction of combined Sacramento and San Joaquin annual runoff over the past 1,000 years (Meko 2009). While many in the media have highlighted the extreme drought of 1976-77, when the measured flow in the Sacramento and San Joaquin combined was only a quarter of the mean flow, the tree-ring data reveal that extreme droughts with even lower flows have occurred at least seven times dating back to 942 AD. The driest year occurred in 1580, when the flow was only 8% of the mean.

Perhaps most concerning in the historical drought data (graph above) is a period of 33 years in the 1400s without any flow more than a few percent above the long-term mean, and 7- and 13-year timespans within that period with no flows exceeding 92% of the long-term mean. Fortunately, consecutive extreme droughts such as these have only occurred 5 times over the last 2 millennia (Hughes and Brown 1992). Although these data put our current dry spell in some historical context, they may be small comfort for those already feeling the pinch of water shortages today.
This post featured in our weekly e-newsletter, the Fish Report. You can subscribe to the Fish Report here.