Monday January 23, 2017
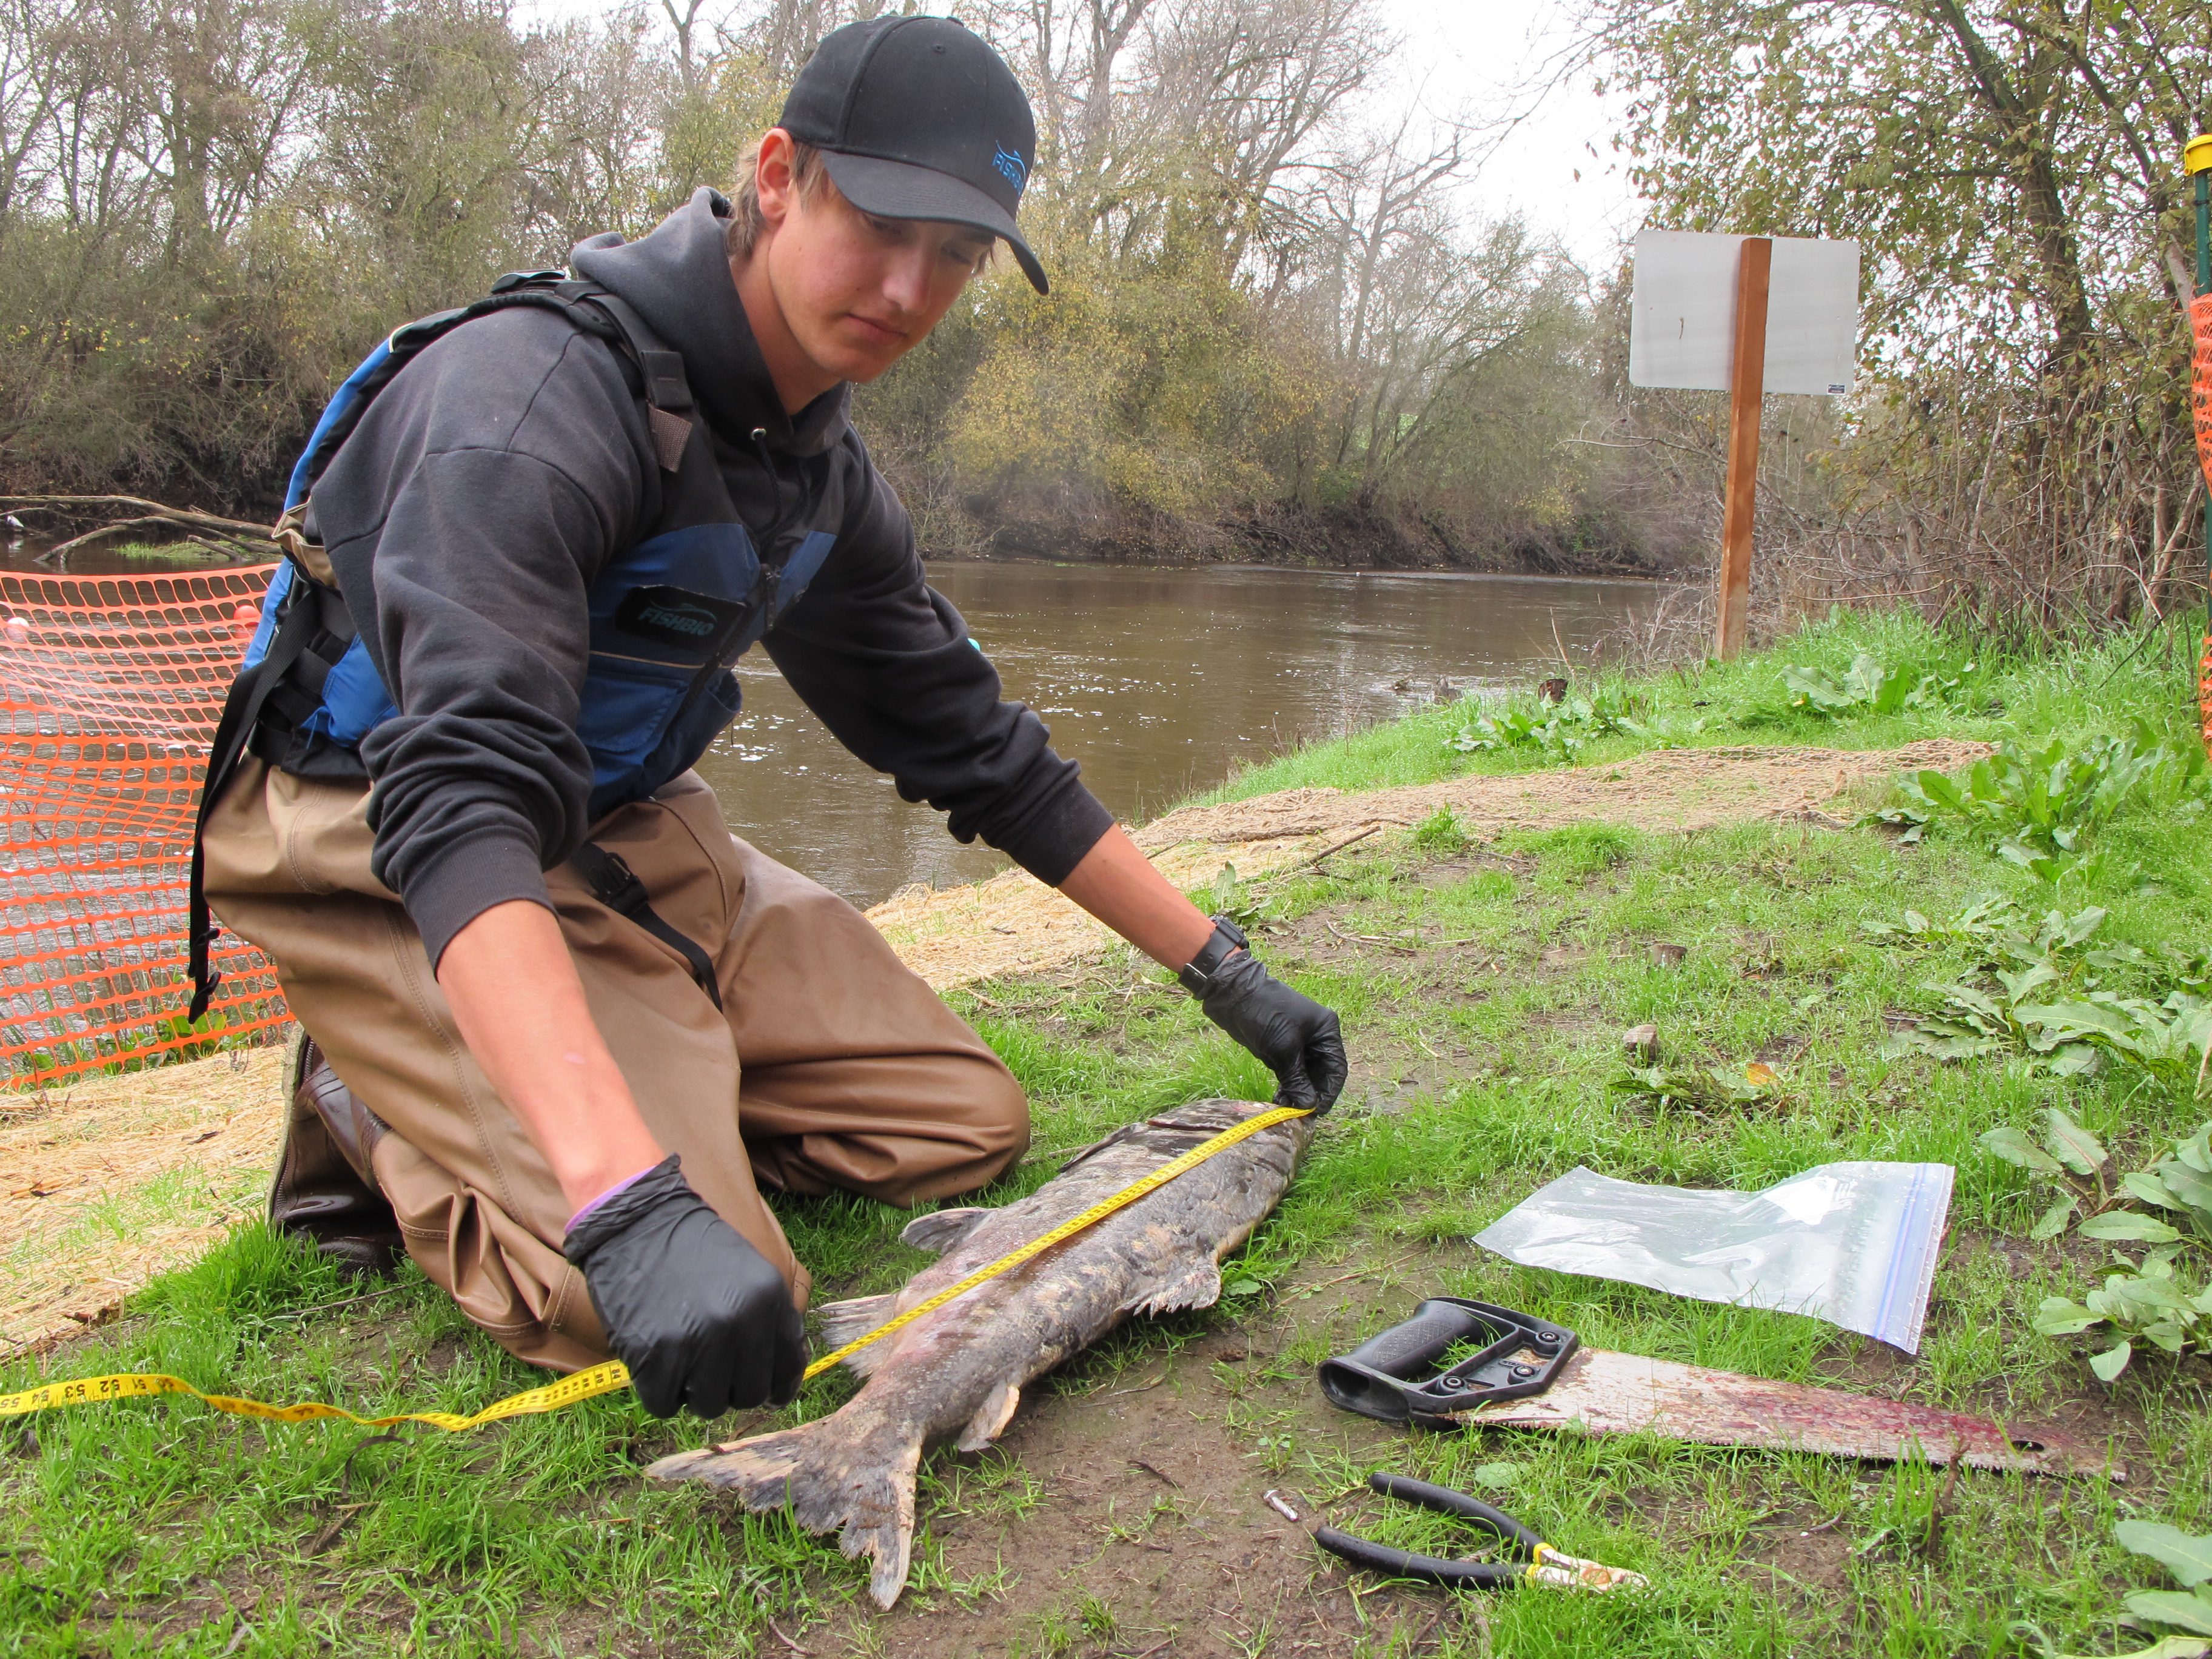
What can you learn from a dead fish? Surprisingly, a lot. Dead salmon are a common sight this time of year, as adult fall-run Chinook salmon perish after migrating upstream from the ocean to spawn in the rivers of California’s Central Valley. Their carcasses then drift downstream, where they either decay in the river, are eaten by animals, wash ashore, or land on one of our fish-counting weirs. Fish scientists can collect information from salmon carcasses found in the field that can help estimate the age of the fish and its origins, assess population numbers, and determine fish reproductive success. We collect this data by taking body measurements, and by marking carcasses for population estimate surveys. We also remove the heads of carcasses to study the fish’s ear bones, or otoliths, which contain a record of the fish’s age. The heads of the fish may also contain a coded wire tag, which indicates the fish was hatchery-reared and provides its brood year. Carcass surveys are also used to estimate the numbers of spawning fish and to see if females laid eggs before they died.
These methods of studying carcasses can reveal a lot about the individual fish we find, and enable making estimates about their entire population. Carcass surveys have been the predominant method for estimating numbers of migrating salmon in rivers, but now in-stream monitoring equipment enables us to automatically count each fish that passes through a fish counting weir, and gain more information than from carcasses alone (See Dead or Alive to compare the two). With a weir, we can also track PIT tag implants that are used for numerous types of fish studies. Still, most fish scientists won’t pass up a chance to get our hands on a salmon carcass to study it up close. Dead animals have recently taken Twitter by storm as scientists submit their #BestCarcass photos, and we definitely had to share one of our own.
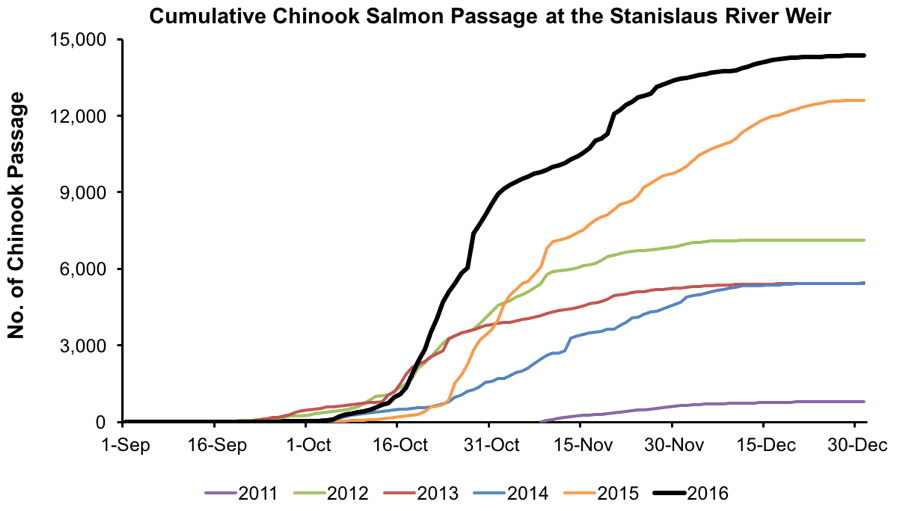
 Figure 1. Cumulative Chinook salmon passage at the Stanislaus River weir, 2011-2016.
While carcass surveys are valuable, fish counting weirs have become one of our standard methods for tracking salmon populations over time. Weir monitoring in the San Joaquin Basin ended in early January in anticipation of the big storms that drenched northern California, and we’ve since been tallying the passage numbers recorded at the weirs. The Stanislaus River had a banner year, with the 2016 fall Chinook salmon run exceeding 14,300 fish. This is the largest run documented at the Stanislaus River weir since the monitoring program began in 2003, topping the already impressive 2015 season total of 12,700 salmon (Figure 1). This return is also one of the largest in the last half-century: since 1952, the California Department of Fish and Wildlife has only twice reported a bigger salmon run in the Stanislaus River. More than 25 percent of the Chinook salmon passing through the weir had a clipped adipose fin. Because hatcheries clip the adipose fins of about 25 percent of the salmon they release, this suggests that nearly all the fish that migrated into the river this season were originally released from a hatchery.
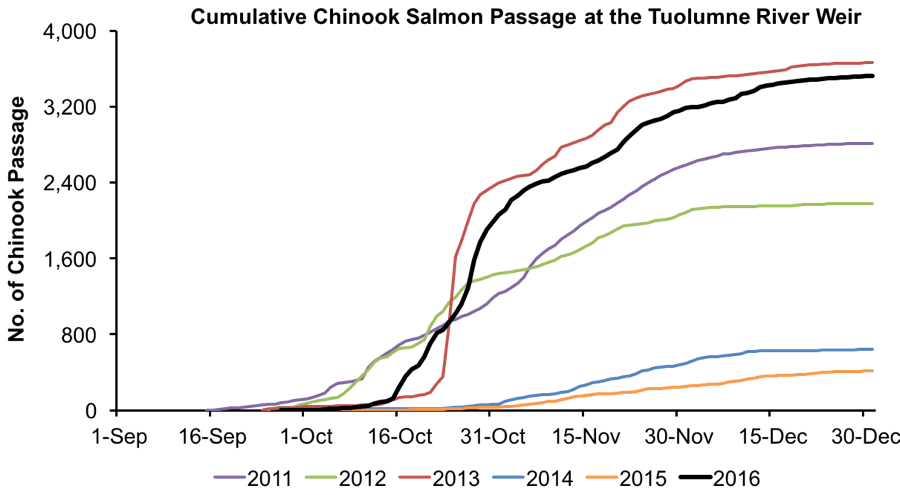
 Figure 2. Cumulative Chinook salmon passage at the Tuolumne River weir, 2011-2016.
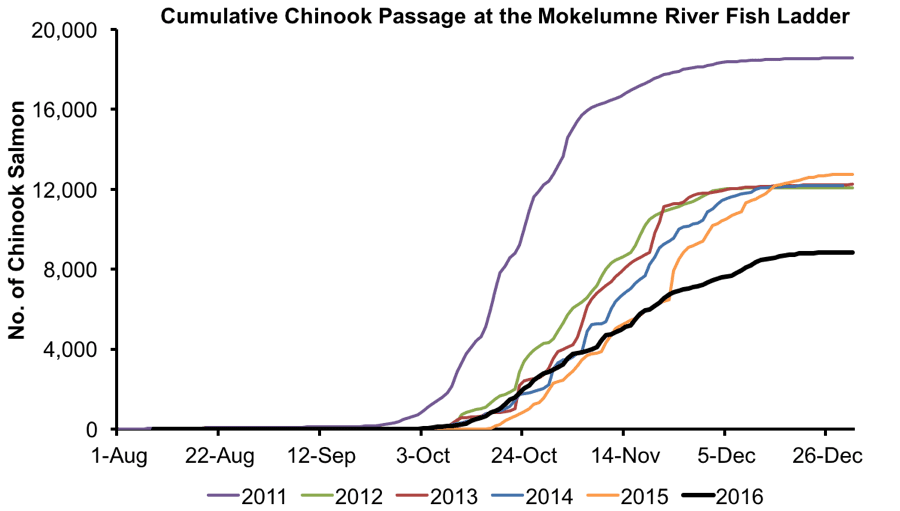
Following two years of less than 700 salmon returning to the Tuolumne River, salmon numbers spiked in 2016, with a season total exceeding 3,500 fish. This is the second largest salmon total recorded at the Tuolumne River weir since the monitoring program began in 2009 (Figure 2). More than 23 percent of salmon passing the weir had a clipped adipose fin, suggesting that nearly all the fish in the river this season were originally released from a hatchery. Elsewhere in the basin, the salmon numbers were down compared to recent trends. While the Mokelumne River Fish Ladder recorded more than 8,000 salmon for the season (Figure 3), salmon totals on the Mokelumne River have consistently hovered around 12,000 fish for the past few years, and 2016 was the lowest run recorded since 2010. Why was it a record year in some places and not in others? We’ll be trying to put all these numbers in context when the Pacific Fisheries Management Council releases salmon numbers for the whole West Coast in coming months. Stay tuned for more!
 Figure 3. Cumulative Chinook salmon passage at the Mokelumne River fish ladder, 2011-2016.
This post featured in our weekly e-newsletter, the Fish Report. You can subscribe to the Fish Report here.

