
Monday November 30, 2020
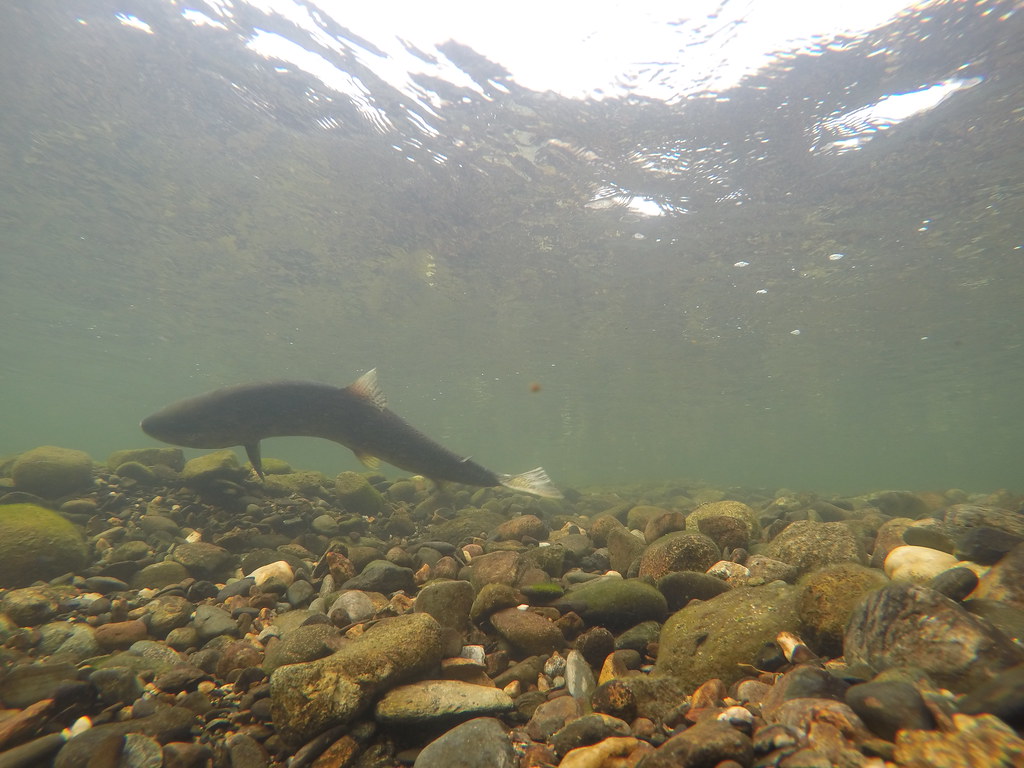
Innovations that make current methods more accurate is one way in which science evolves. Researchers have recently done just that for mapping salmon spawning locations, or redds. Counting redds on a riverbed during the salmon spawning season allows for monitoring salmon population fluctuations, and determining habitat conditions that salmon consider favorable for laying their eggs. Commonly, redd mapping is done by manual field surveys or helicopters, and in recent years, by remote sensing using drones. In a new study published in the journal River Research and Applications, scientists made the first effort to test two types of remote sensing used with drones for surveying redds: red, green, blue (RGB) and hyperspectral imagery. They also applied a semi-automated method of analysis for the first time. (Harrison et al. 2020). The study covered the Chinook salmon fall run at a spawning hotspot at the base of the Nimbus Dam on the lower American River in Sacramento, California. The researchers found that RGB, or “true color” imagery, which is more commonly used and less expensive, could detect redds with 75% accuracy compared to 86% accuracy using hyperspectral imagery.
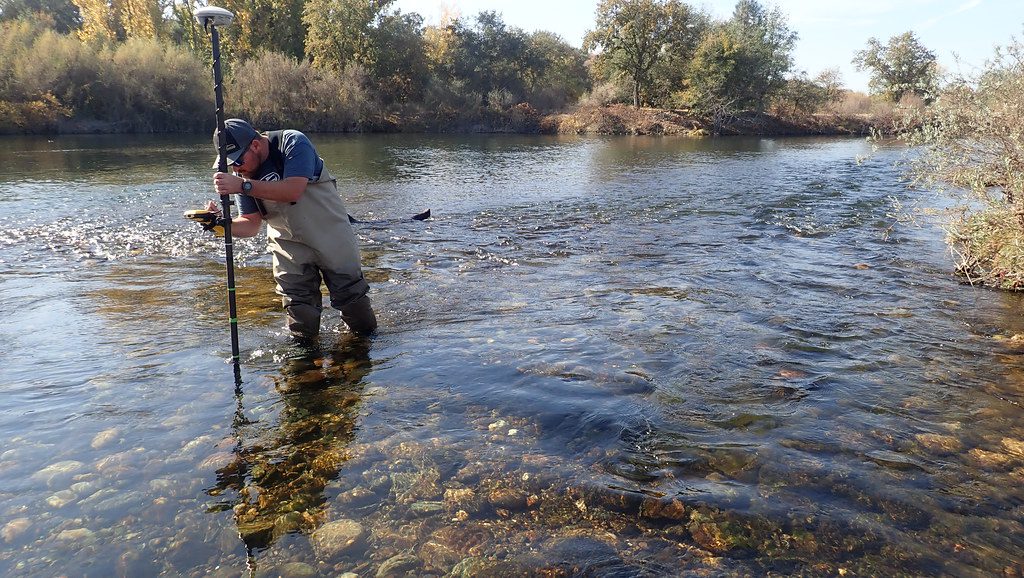
When female salmon return to rivers to spawn, they use their tails to flip over rocks to build their redds. The lack of algae on the undersides of flipped rocks makes redds appear lighter in color than the surrounding riverbed, which helps scientists spot them during surveys – but can be a challenging task. Scientists can wade into the river to conduct manual field surveys if conditions allow, but this method is subject to error of the human eye. Helicopters can also be used to map redds from above, especially when river conditions are dangerous, but there are other safety concerns and still room for human error. Remote sensing using UAS (unmanned aircraft systems), also known as drones, allows for greater spatial coverage, higher resolution, and continuous collection of data. The drone height and speed can also be adjusted to improve both resolution and exposure time of recorded images. Using water depth and chlorophyll absorption ratios derived from hyperspectral imagery, the researchers created a predictive model to determine where redds were likely to occur. Chlorophyll absorption levels are helpful because redd locations are lower in chlorophyll due to the overturned rocks that are clean of algae. The remote sensing data was compared to data acquired from a manual ground survey.

RGB and hyperspectral imaging have a few basic differences, and this study examined their pros and cons. RGB imagery assigns only the primary colors to each pixel in the image, and functions in the same way the human eye perceives an image. These images did not provide useful depth information, and the redds could not be detected by using depth or chlorophyll as predictors. A benefit of RGB imaging was that the results lined up spatially with a habitat map from the ground survey, but the lack of associated depth and chlorophyll absorption data meant that the semi-automated analysis could not be applied to this imagery. In contrast, the hyperspectral images did not initially match the habitat map, which increased the amount of processing time needed, but the data could be analyzed with a semi-automated redd classification process. Hyperspectral imaging is a newer type of remote sensing that measures the full spectrum of light in every pixel in the image. The hyperspectral images obtained in this study provided much higher resolution than RGB imaging. The major benefit of the hyperspectral method was that it also effectively mapped river depth, giving the ability to simultaneously map redds while quantifying habitat characteristics.
Remote sensing is a valuable new tool for mapping redds because it is more efficient, leaves less room for human error, poses less risk of redd disturbance, and the drone technology used to conduct these surveys continues to advance. The researchers concluded that RGB imaging is best for rapid data collection because less processing time is needed for these images. This may make it particularly well-suited for daily or weekly redd surveys over the course of a spawning season. While hyperspectral imagery takes longer to process, it might eventually be able to tell us more about favorable habitat conditions associated with redd locations, which scientists hope to assess in future studies. Water depth, grain size, currents and surface flow are among the variables that may influence where salmon chose to create redds. This study is a baseline that could further facilitate redd mapping paired with habitat modeling using hyperspectral imaging. Other future directions are to develop ways for drones to map redds on a larger spatial scale, which could greatly streamline studies of salmon spawning.
This story was written by Andrea Dempsey as part of an internship with FISHBIO. It was featured in our weekly e-newsletter, the Fish Report. You can subscribe to the Fish Report here.