
Monday October 2, 2017
The 2017 water year has come to a close, and it certainly proved to be a drought buster. In western states, precipitation is gauged not on the calendar year, but on a water year that begins on October 1st (when rivers and reservoirs are naturally at their lowest) and ends on September 30th. At this time last year, it appeared like California was destined for a sixth year of drought, but forecasts quickly took a different turn. Throughout the winter of 2016–2017, a parade of more than 30 atmospheric rivers rolled through California, including three that were classified as “extreme.” According to a recent study, such atmospheric rivers will take a more prominent role in California’s already highly variable climate in the future due to climate change (Gershunov et al. 2017).
California was blanketed by ample snow this year, like the 47.6 feet measured at Donner Pass. January was particularly ferocious, with back-to-back storms hitting the Tahoe region and piling up over 23 feet of snow at Squaw Valley ski resort. Storms raised Lake Tahoe by 6.5 feet, the most change experienced in one season! The statewide snow water equivalent was 163% of average on April 1, 2017, the benchmark date used to measure peak snowpack. While the snowpack was impressive, it was the contribution of rain in the Northern Sierra that really set the records. The Northern Sierra Precipitation 8-station Index measured 94.7 inches of precipitation (189% of average), making this the wettest year on record, and beating the 1982–1983 winter by six inches! The Central and Southern Sierra Precipitation Indices didn’t set any records but came close, finishing at 179% and 160% of average, respectively.
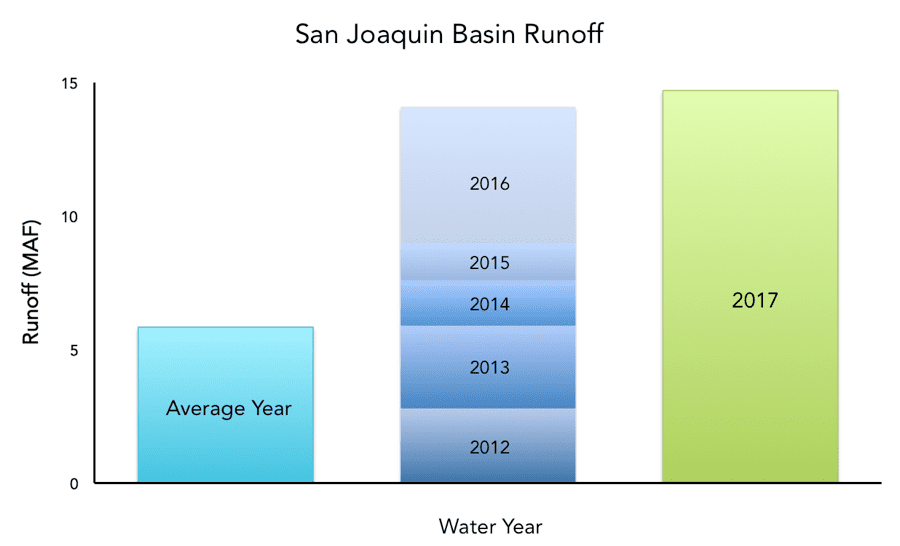 While snow and precipitation were impressive, the combined runoff from snowmelt and precipitation really shows the magnitude of the water year. State hydrologists measure unimpaired runoff, in Millions of Acre Feet (MAF), to generate indices for the Sacramento and San Joaquin rivers. The San Joaquin Valley Index calculation is based on the runoff from the Stanislaus, Tuolumne, Merced, and San Joaquin Rivers. Summing the 2017 station data for San Joaquin Basin runoff yields a total of 14.5 MAF, which is more than double the amount of an average year (5.84 MAF), and even more than the last five drought years combined! This year was just shy of the record runoff of the last hundred years, which was set in 1983 at 15.01 MAF.
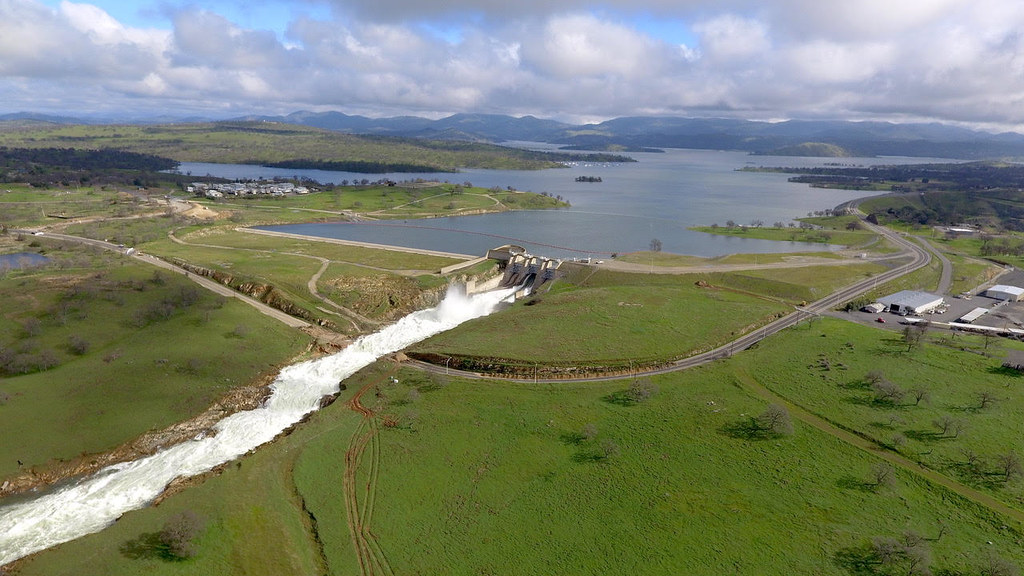
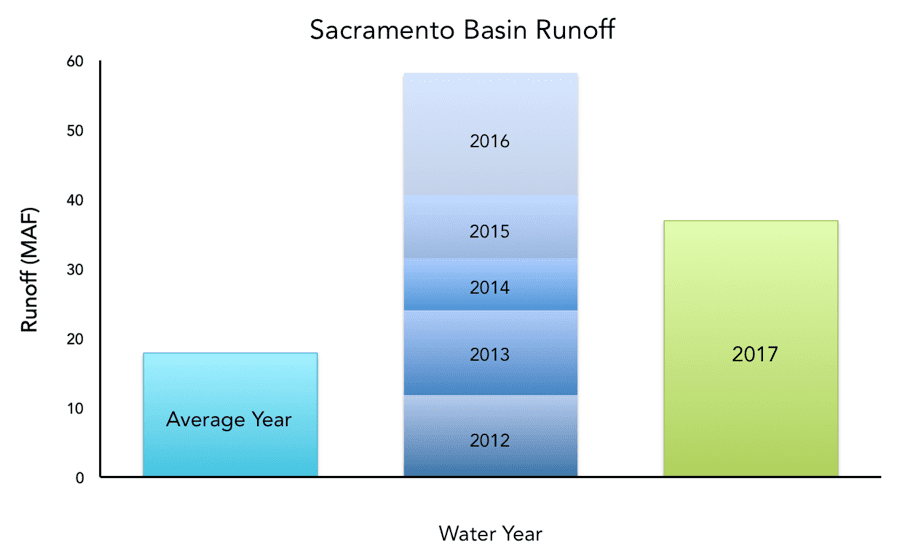 The Sacramento Valley Index calculation is based on the runoff from the Sacramento, Feather, Yuba, and American Rivers. The 2017 combined runoff in the Sacramento Basin was 36.9 MAF, nearly double the amount of an average year, but still less than the record of 37.68 MAF also set in 1983. It was this near-record runoff that prompted the evacuation of the town of Oroville after the reservoir filled and water started flowing over the emergency spillway at Oroville Dam, resulting in severe damage to the main spillway.
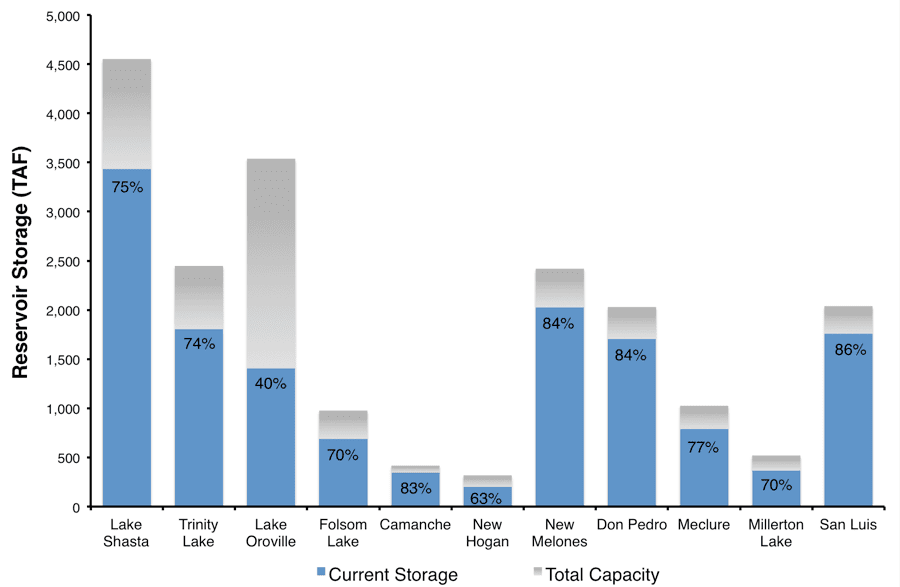 With such high runoff in the Central Valley, it is no surprise that major reservoirs are currently well above average, with the exception of Lake Oroville due to water released for the spillway fix. After substantial flooding this winter, many Central Valley rivers continued to be at or near flood stage throughout the spring, and some even continued evacuating water during the summer to make room for the upcoming winter. It looks like there is an increasing chance (55-60%) of a La Niña year brewing, which usually results in below-average precipitation for Central and Southern California. However, the National Weather Service Climate Prediction Center states there are currently equal chances of below normal, normal, or above normal precipitation in California over the next three months. And so the delicate dance of water management begins!
This post featured in our weekly e-newsletter, the Fish Report. You can subscribe to the Fish Report here.