
Wednesday October 7, 2015

Fall is homecoming season for a variety of migrating fish species, including fall-run Chinook salmon on the Stanislaus River. After two or three years of living in the ocean (or even longer), the fish are now making a long journey back to the streams where they were born. In our version of rolling out the red carpet, we prepare for the salmon to arrive by putting up a fence: not to keep the fish out, but to make sure we can count every single one that returns to the river. The fence-like structure is a called a resistance board weir, and our crews have installed one on the Stanislaus River every fall for 12 years, thanks to support from the Oakdale Irrigation District, South San Joaquin Irrigation District, and Tri-Dam. The weir guides the fish swimming upstream through a single opening, where they are counted with the help of our Riverwatcher automatic fish counter (housed in the rectangular “cage” being constructed in the photo above).
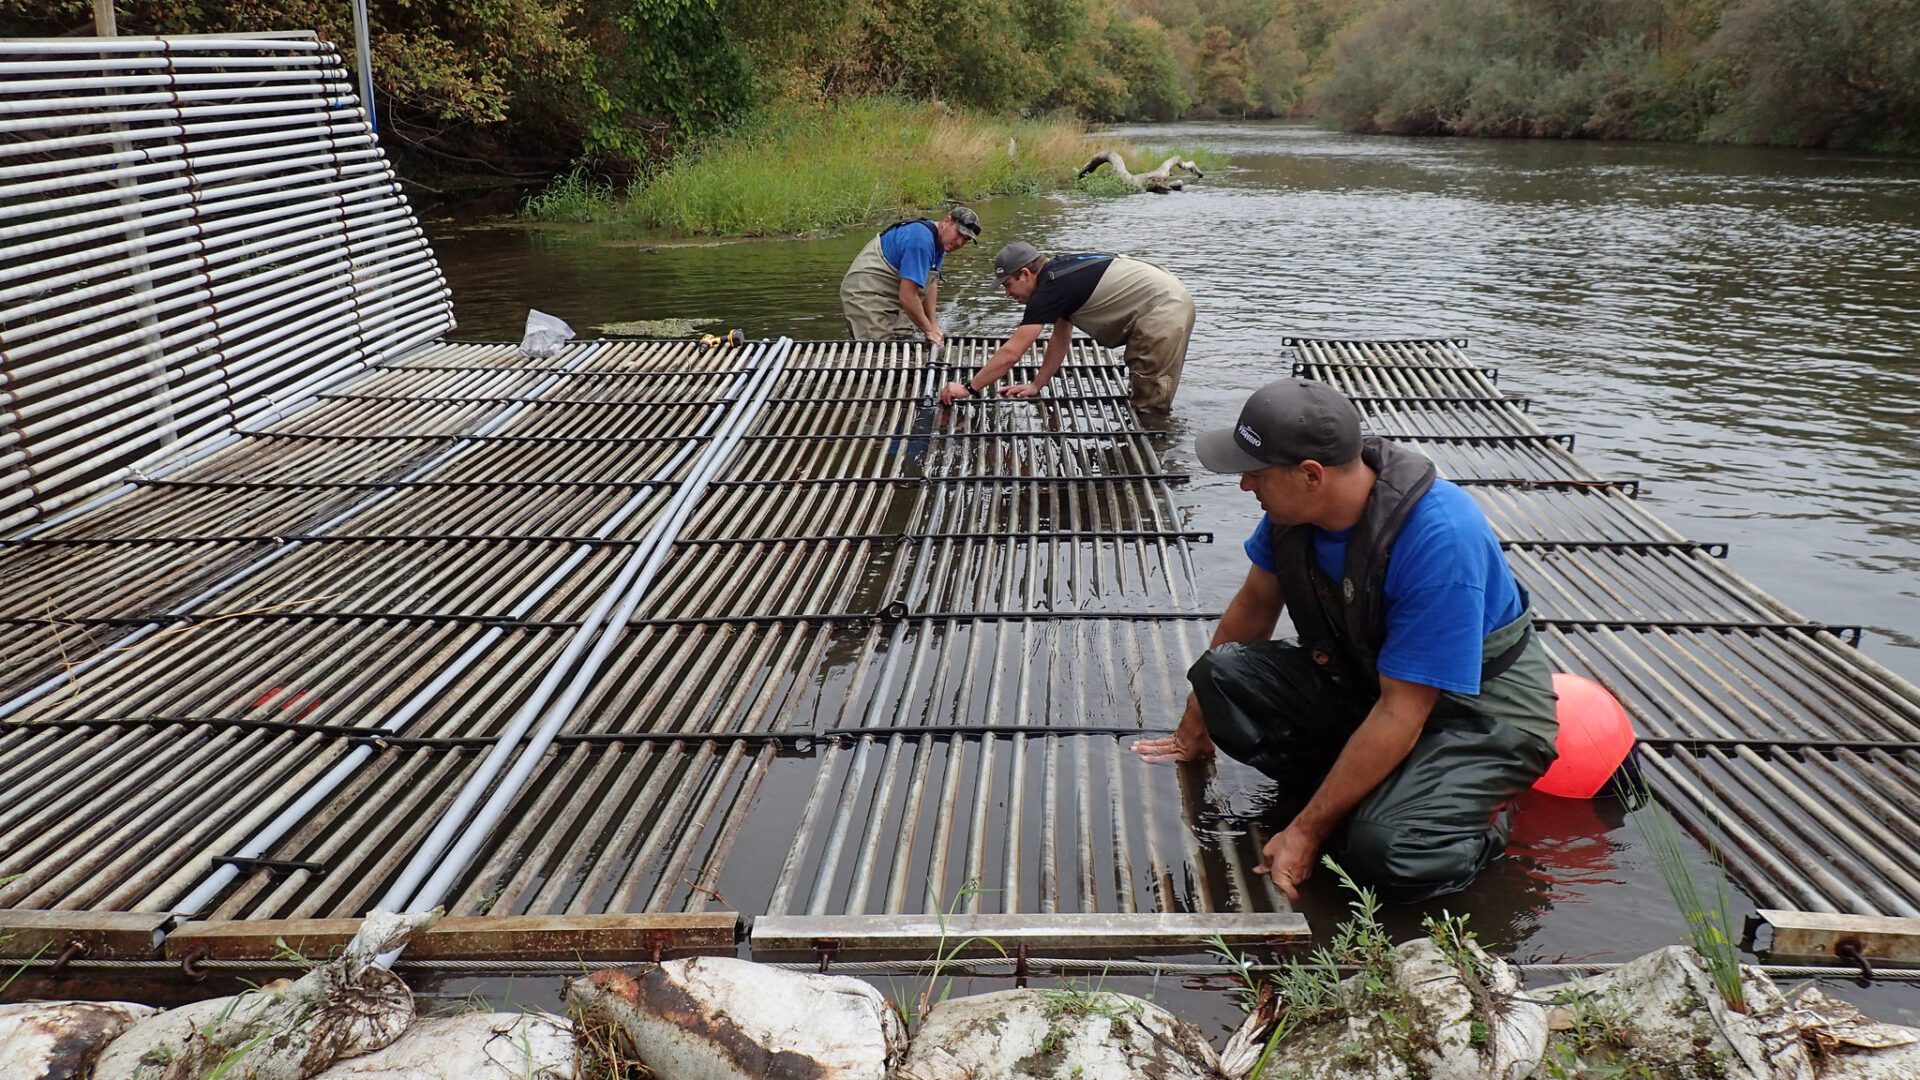
These tools lets us know exactly how many salmon have returned to the river, and allow us to track other species, such as rainbow trout/steelhead, striped bass, and even beavers. The Riverwatcher records photos and videos of every fish, which help determine fish sex, size, general health, and whether the fish came from a hatchery. We also use the information to help study how environmental factors like river flow and water temperature affect the migration of these fish. Once a salmon swims under the Golden Gate Bridge into San Francisco Bay, it still has to swim more than 150 miles before it reaches our weir. These fish are truly marathon swimmers!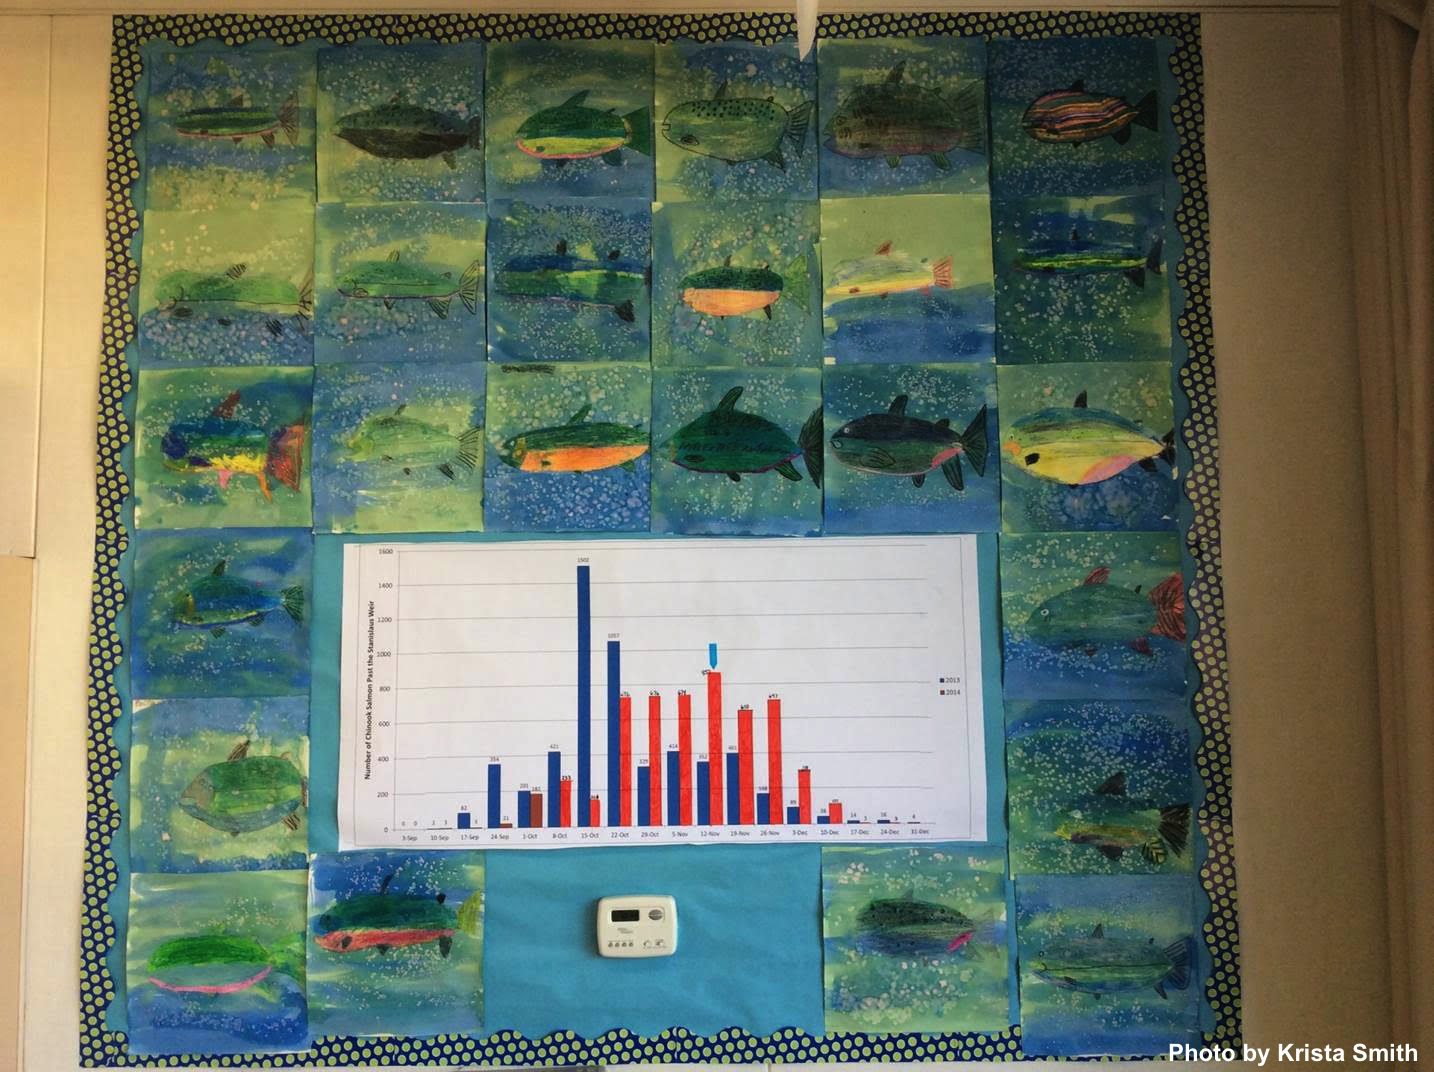
As part of our Three Rivers Education program, last year we started sharing the weekly counts from the Stanislaus weir with classrooms in Oakdale to supplement the salmon curriculum taught to all fourth graders. This allowed students to practice graphing real fisheries data and follow the migration as it was happening in their own backyard. One classroom decorated their graph with some great salmon art shown above. The students learned that scientists can make lots of predictions about salmon migrations, but when it comes to how the fish will actually behave, we have to wait and see. At the beginning of the season, we never know just how many fish will actually return to the river, or what the timing of their migration will be. Will they come all at once, with a big spike in fish numbers? Or will they come in more slowly, but steady?

As you can see from last year’s graph comparing weekly fish counts in 2013 (blue) and 2014 (red), most of the salmon arrived early in 2013, with a big spike in mid October, while in 2014, the fish arrived more gradually. In the end, the total number of salmon that arrived by December 31 was quite similar in both years, about 5,400 fish. The graph shows how two different migration patterns can give the same end result. A number of the teachers said that their students enjoyed the activity, and it got them thinking about many questions related to salmon. We hope it’s the perfect build-up to the school district’s annual fourth grade field trip to see the salmon spawning at Knights Ferry. We’ll be tracking the progress of the salmon this year with much anticipation!